Traffic Analyzer Turns Redis and Valkey MONITOR Output Into a Cache Hit-Rate Curve That Matched a Real Server
A Redis server is running hot and the question is what with. INFO commandstats counts commands but can’t say which keys or which clients. The slow log only keeps the slow ones. MONITOR shows everything, every command with its keys and the address that sent it, but at 30,000 lines a second nobody reads it.
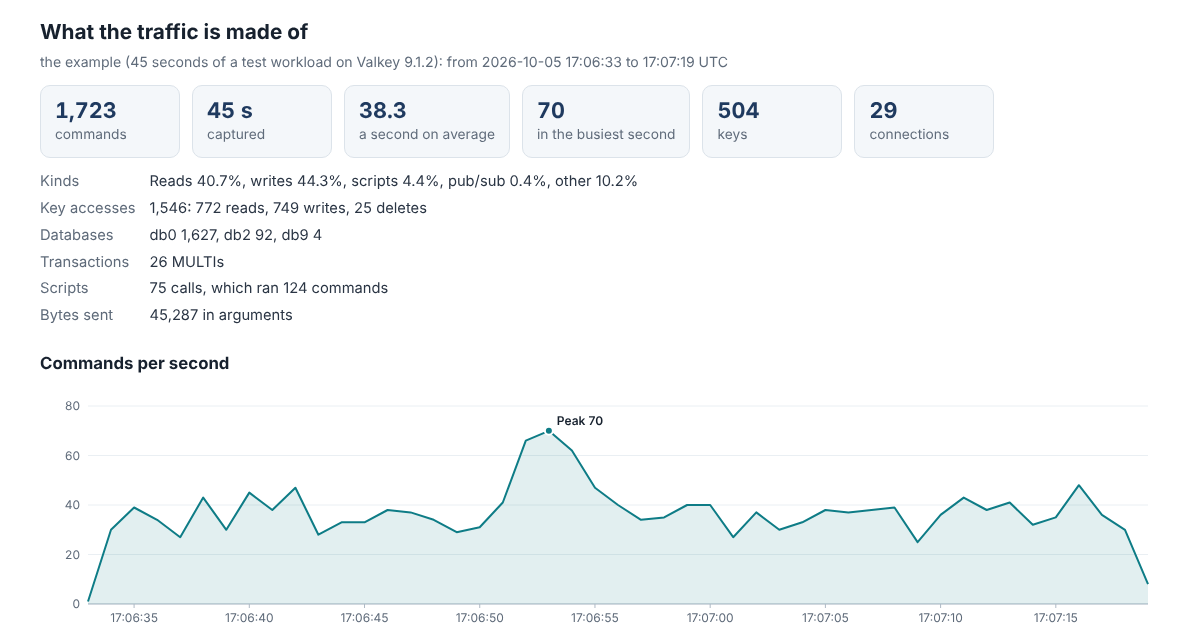
The Traffic Analyzer reads a MONITOR capture in your browser and adds it up: commands per second, the command mix, reads against writes, the busiest keys and key patterns, which clients send what, how the keys would spread over a cluster, commands worth a second look, and how many keys a cache would need to hold.
It runs in your browser and doesn’t send anything anywhere, and the page’s security policy stops it from fetching or loading anything from another site. A capture holds real keys and values, so that matters.
What It Points Out
One key with a tenth of all the traffic is a hot key, and in a cluster every request for it lands on the same primary. KEYS walks the whole keyspace while every other client waits. HGETALL, SMEMBERS and LRANGE 0 -1 return whole collections, fine when they’re small and slow when they’ve grown.
If a move to a cluster is coming, commands whose keys hash to different slots will fail there with CROSSSLOT, and Redis Cluster has only database 0. The analyzer counts both and shows how the key accesses would land on 1 to 16 primaries.
It also notes habits worth changing, like a SET followed by a separate EXPIRE, which leaves the key without an expiry if the client stops in between, or scripts sent in full with EVAL every time.
How Many Keys a Cache Needs
For every read in the capture, the analyzer counts how many other keys were used since the same key was used last. A least-recently-used cache holding more keys than that still has the key, so the read is a hit. One pass gives the hit rate for every cache size at once. The method comes from a 1970 IBM paper on storage hierarchies, and it needs one change for key-value traffic: a deleted key frees its slot, and the next new key takes the slot without pushing anything out. The analyzer tracks those free slots, so the curve stays exact when the traffic deletes keys.
Real servers don’t run an exact LRU. With allkeys-lru, Redis and Valkey pick 5 keys at random and evict the one unused longest. To see how much that matters, Valkey 9.1.2 ran with 4 MB of memory and took 720,000 reads over 300,000 keys while MONITOR recorded. It held about 21,850 keys and served 57.3% of the reads. The curve built from the capture said 57.6% for that many keys. With 10 samples instead of 5, the server served 57.5%.
What MONITOR Leaves Out
The five servers in the test were Valkey 9.1.2 and Redis 8.10.2, 7.2.16, 6.2.24 and 2.8.24, and they didn’t all show the same commands. None showed admin commands such as CONFIG GET, CLIENT LIST and SLOWLOG GET, but what counts as admin has changed: Redis 2.8 showed CLIENT LIST and SLOWLOG GET, and Redis 6.2 hid CLIENT SETNAME too, because CLIENT as a whole was an admin command then. QUIT showed up from Redis 7.2 on, and in Valkey 9.1, but not in 6.2 or 2.8.
Passwords never show. AUTH and HELLO ... AUTH come out as "(redacted)", user name included. Commands the server refuses before running them, like an unknown command or a GET without its key, are missing, while commands that run and fail are there, even inside a script.
Checked Against Five Servers
A script ran the same workload on each server from six client addresses: three web servers, a background worker, a nightly job and a cron host that opened a new connection every time, sending 61 different commands between them. All 4,757 lines read back byte for byte as sent. The keys of every command matched COMMAND GETKEYS, key slots matched CLUSTER KEYSLOT for all 1,492 keys, and the totals and findings matched counts made from what was sent.
The analyzer is one JavaScript file with no dependencies, open source under the Apache License 2.0. The command line reads a capture of 3 million commands in about 11 seconds, and it can read straight from MONITOR:
node traffic/cli.js monitor.txt
timeout 30 redis-cli MONITOR | node traffic/cli.js -
The manual, the tests and the captures they replay are in the traffic folder on GitHub.